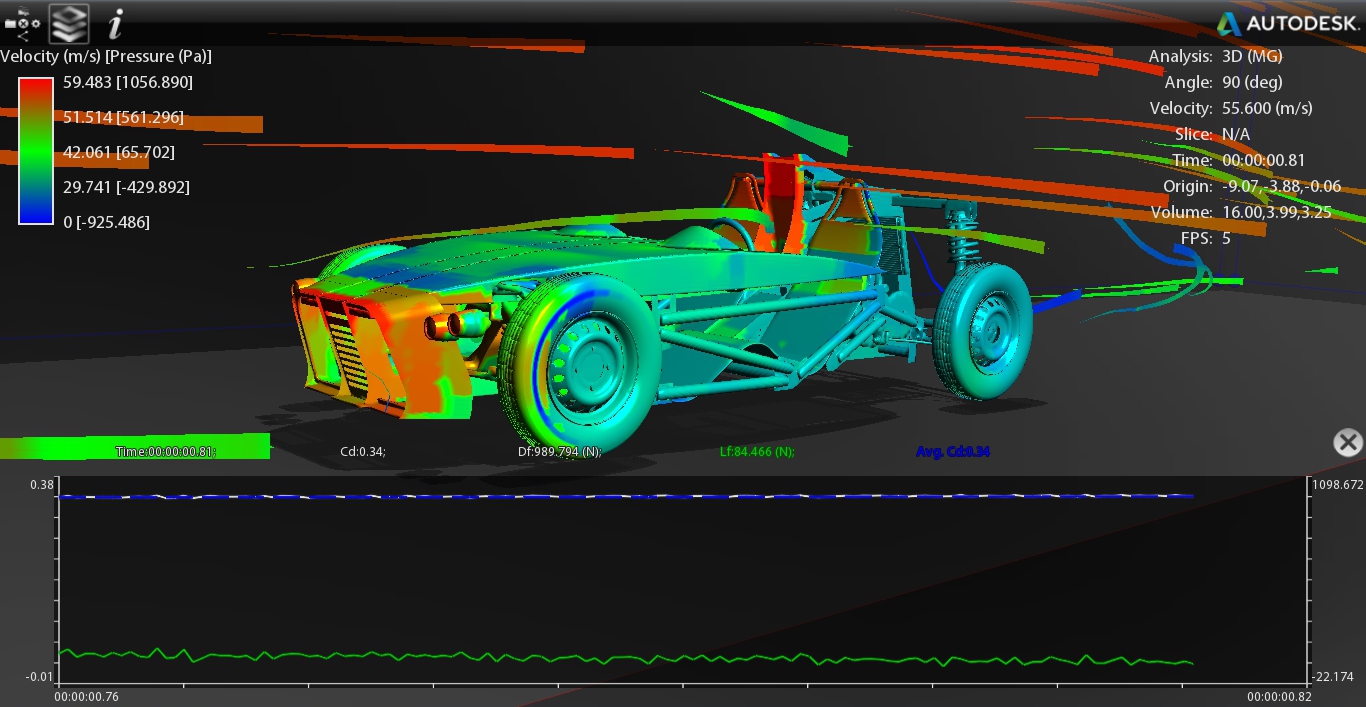
Virtual wind tunnel Autodesk Falcon allowed us to study aerodynamic characteristics of RockFoxie 2.02 prototype. Image below demonstrates the 1 hour 46 minutes blow-through result (0.81 second of process time). The flow speed is 56.6 m/s (200km/h) along the lengthwise axis of vehicle.
The research results:
We're really happy with researches results. Coefficient of drag is just magnificent fir open-wheel vehicle! And more, that's the first experience for RockFoxie. It's time to analyze results and optimize the airflows to get aerodynamic advantage. But it's clear right now that the backbone between the seats should be enhanced (in red zone).
The research process.
The research process took 1 hour 46 minutes of real time. We show some screenshots demonstrating how the experiment went.
00:00:00. 7's hundredth of a second of virtual process.
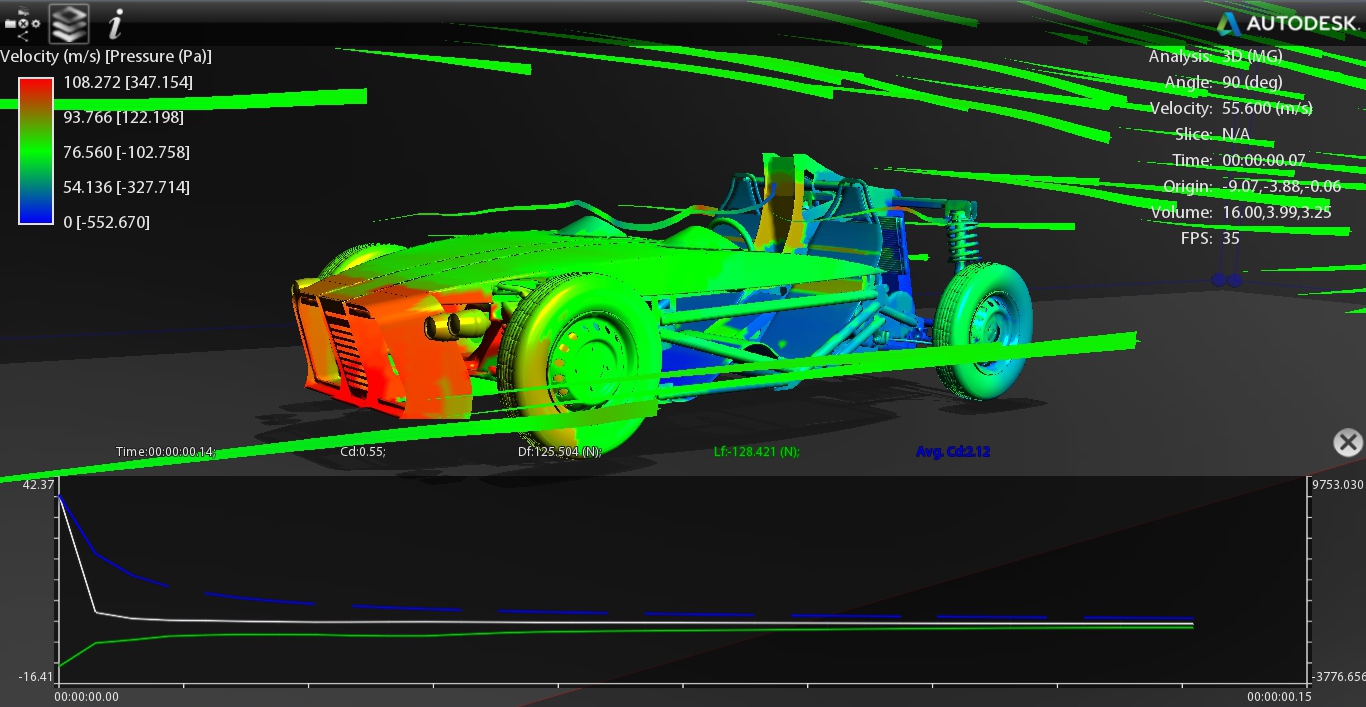
Начало продувки. Inauthentic results. All the pressure is on the nose cowl.
00:30. 14's hundredth of a second of virtual process.
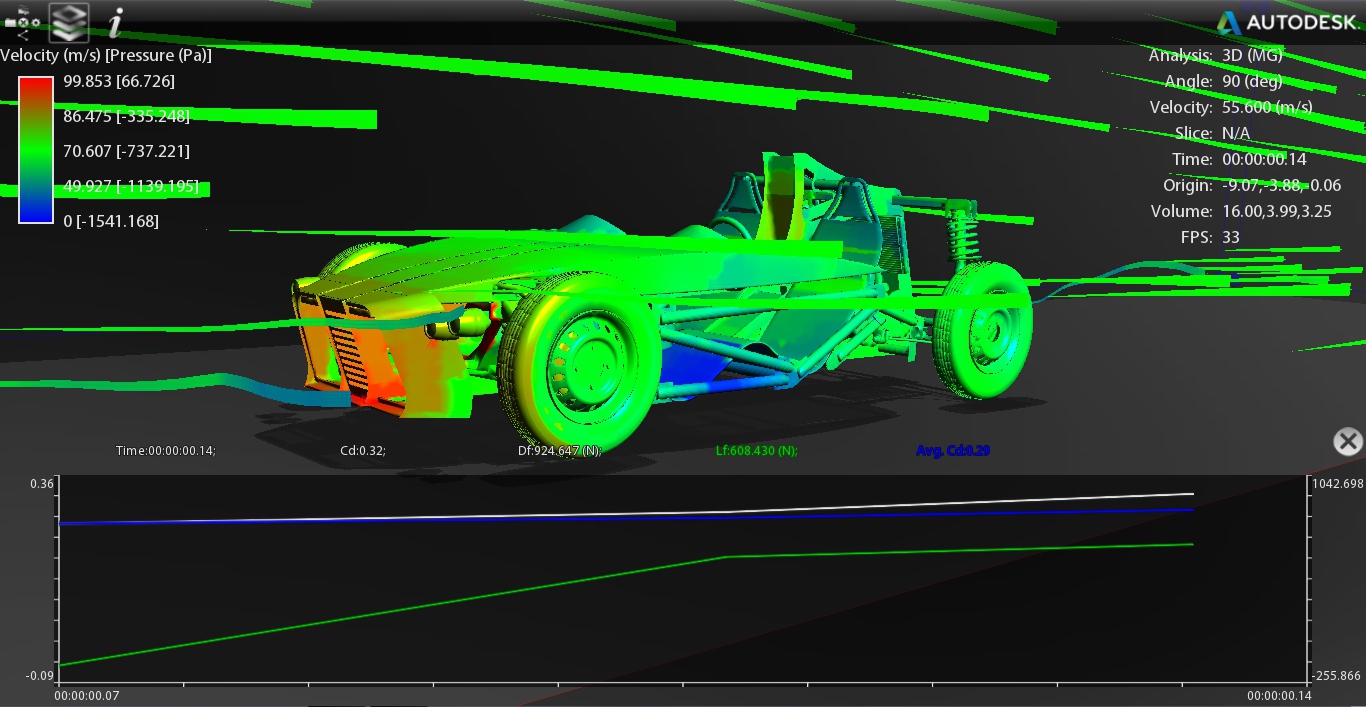
Numerical data Cd, Df, Lf are close to final result, but the pressure spread and airflow speed are still unproper.
05:45. 28's hundredth of a second of virtual process.
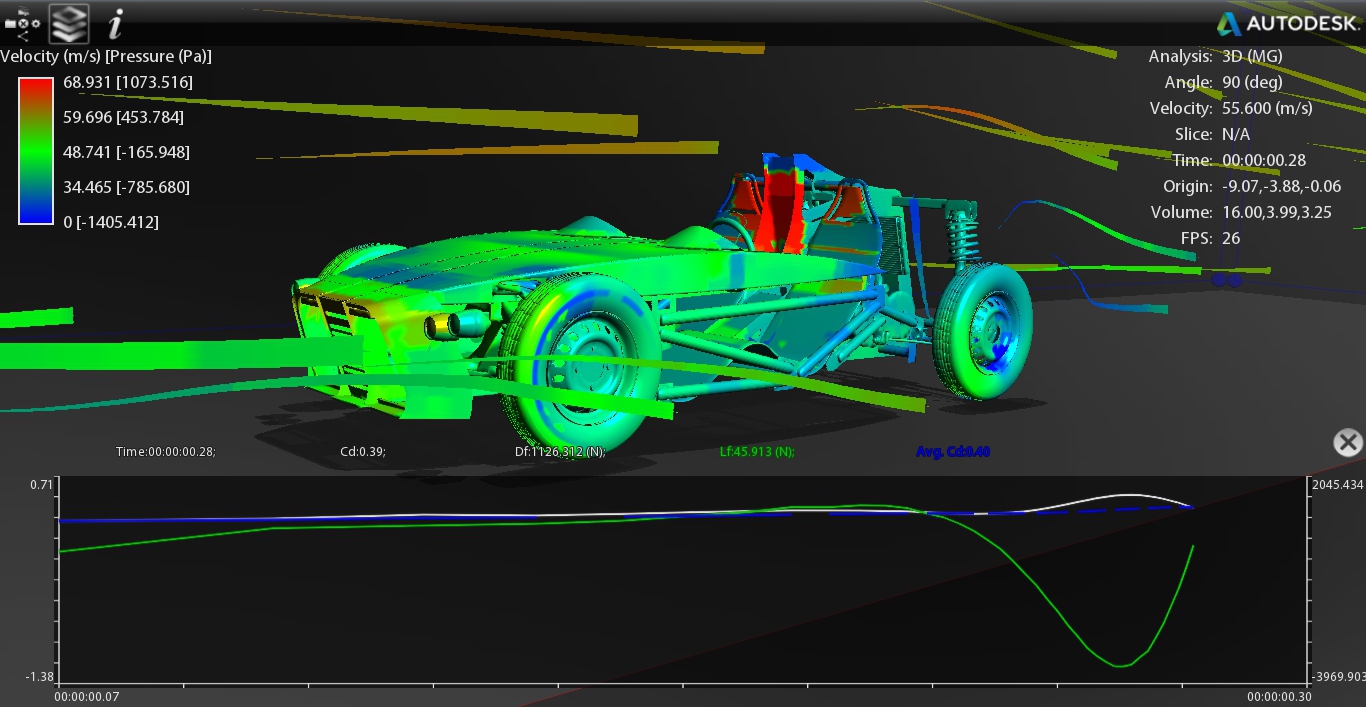
Sinusoids start forming. The highest amplitude curve is of a lifting force. Lower coil of sinusoid is characterized with maximum Cd and minimum (negative) lifting force.
08:17. 30's hundredth of a second of virtual process.
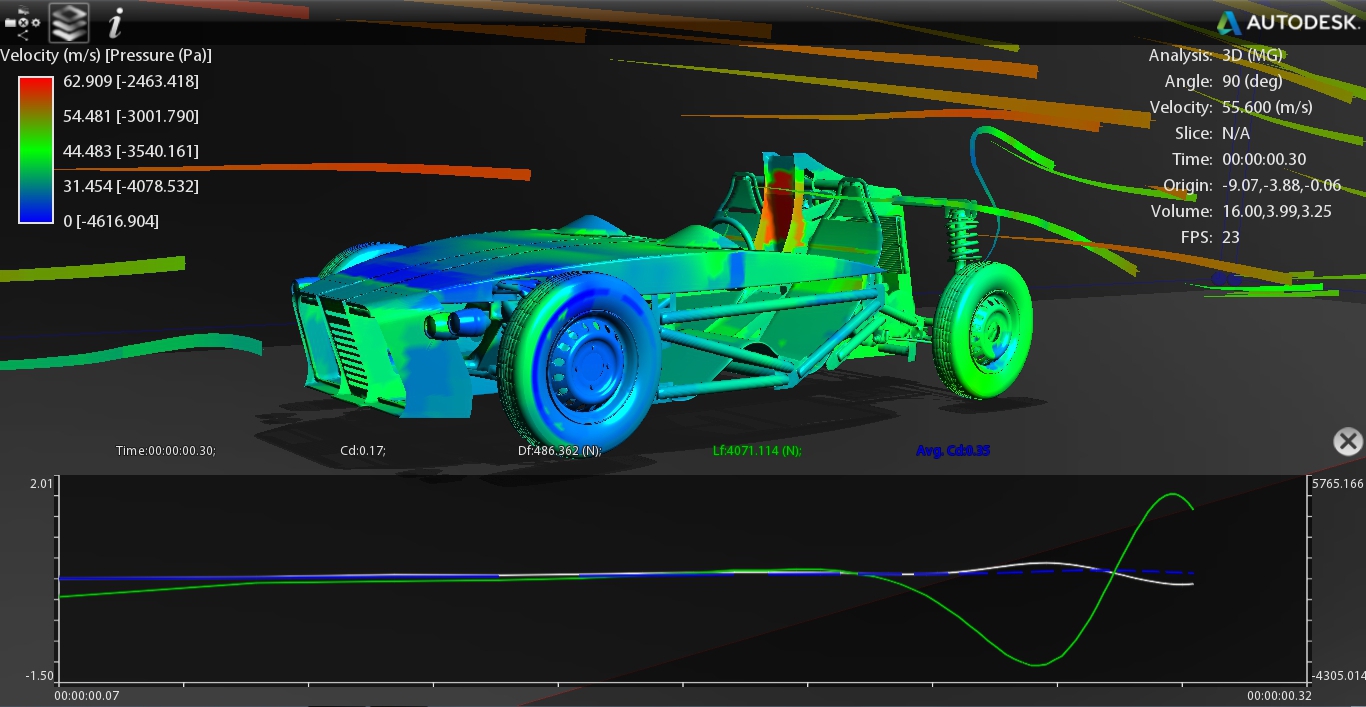
Upper coil of sinusoid is characterized with minimum Cd and maximum Lf. The minimal marked Cd is 0,12!
38:37. 44's hundredth of a second of virtual process.

Sinusoids are formed. Amplitudes is getting lower. It's seen that curves should straighten with time.
1:46:36. 81's hundredth of a second of virtual process.
Sinusoids became almost straight after 1 hour 46 minutes. Cd, Df, Lf became constant. It's time to finish virtual blow-through. We've got magnificent results!
No comments:
Post a Comment